
We are in 2021 now and things really have changed drastically but have it all changed according to what we used to imagine as kids? Do you remember thinking that there would be flying cars and you would have to start worrying about “air traffic” than your local day-to-day traffic on the road? Road traffic has indeed reduced these days but it is not because people are flying their way to destinations; it is because we’re all stuck at home, working from home, going to school but still from home. With all the things happening in the country and around the world, have you not once thought or even joked around with your family or friends saying “We might actually be on the verge of the End of the World”? And thinking of the End of the World, do you hear an echo from the past? Remember 2012? The supposed year of Doomsday, the End of the World!
For all those oblivious to the speculations; 2012 was the year that marked the end of one of the cycles of the ancient Mayan Calendar but, for those who had a more scientific perspective, 2012 was the year that newly discovered planet Nibiru was supposedly headed towards Earth entailing a catastrophic collision (NASA, 2012). Regardless of the perspective, it all added up to the End of the World in 2012! So 2012 was a year filled with too many end-of-the-world jokes, and also a fair amount of genuine fear. But thankfully you are luckily alive to be reading this article! So 2012 ended up being a typical year for everyone, OR did it? Just have a look at Figure 1.
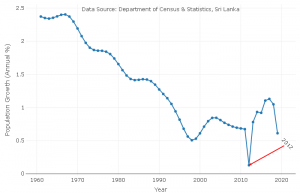
Figure 1: Population growth of Sri Lanka (annual %) 1960–2018
The above graph depicts the annual population growth of Sri Lanka as a percentage, across the past 6 decades. This decreasing pattern is common for all countries with the decrease in fertility rate (total births per woman); for in an industrialized society, having a higher number of children is considered more of an economic burden and as once stated by the UN — “Development is the best contraceptive”. But presumably, you must have noticed an atypical drop in the population growth, now take a look at the year which the drop corresponds to; 2012! Was Sri Lanka unknowingly on the brink of Doomsday? What sort of a story is the data trying to tell us? Let’s Explore!
So fear not dear reader, this actually has nothing to do with the End of the World. What Sri Lanka experienced in 2012 is more commonly referred to as a short-term population shock. Short-term population shock is an abrupt reduction in human population size; the many causes of it being short-term events such as pandemics, wars, famines, or other catastrophes (Wikipedia, 2021). So what caused the 2012 population shock in Sri Lanka? In the latter part of 2011, Sri Lanka was impacted by the floods described as the worst for the last five decades by the people who were affected by the flood. This affected 1.2 million people and 18 out of 25 districts across the island; flooding through paddy fields, land fisheries, and field crops (IFRS, 2012).
What about 2020?
Sri Lanka has been battling the COVID-19 pandemic since 2020 and the country is yet to recover from it. So it got us curious, what sort of a population shock will be caused by COVID-19? We decided to quantify this through Excess Mortality; the number of deaths from all causes during a crisis above and beyond what we would have expected to see under ‘normal’ conditions. Excess mortality can be measured in many ways, one of them being P-score (Giattino, et al., 2021). P-score calculates excess mortality as the percentage difference between the number of deaths in 2020–2021 and the average number of deaths in the same period over the years 2015–2019. And hence, we used P-score in our analysis considering the time period of one year.
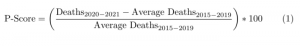
So now let’s get to the FUN part of the article! How did we actually predict the total number of deaths in 2020 and 2021? Well, we considered two components to the total number of deaths in 2020 and 2021; total deaths that would have occurred without COVID-19 and total deaths due to COVID-19 and voilà you get the total number of deaths for 2020 and 2021, assuming all other conditions remain the same (It’s not truly statistics until we have an assumption right?).
Let’s forecast Sri Lanka’s Annual Deaths without COVID-19!
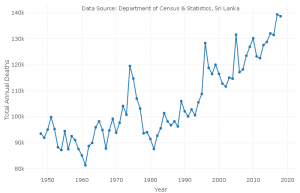
Figure 2: Time series plot of Total Annual Deaths of Sri Lanka 1948–2018
The total annual deaths without COVID-19 was calculated by fitting an ARIMA (Auto Regressive Integrated Moving Average) model to the deaths of Sri Lanka from 1948–2018 (Figure 2). An ARIMA model dear reader is a statistical analysis model that enables us to use time series data to predict future trends based on past values.
Initially, the data was divided into two parts as training and testing set with an 80:20 ratio. The model was fit to the training set consisting of annual deaths from 1948 to 2003 and the corresponding model error was calculated through the testing set consisting of annual deaths from 2004 to 2018 . We were able to identify visually an increasing (upward) trend without cyclical variation and hence to overcome the non-stationary pattern of the data differencing was applied. In order to identify the model, Autocorrelation function (ACF) and Partial Autocorrelation function (PACF) plots with 5% level of significance limits for the auto correlations were generated and the results showed exponential decaying pattern on ACF and PACF got cut-off at lag 1 (Figure 3, Figure 4). Thus we can decide on the initial guess of the resulting ARIMA model as ARIMA(1,2,0).
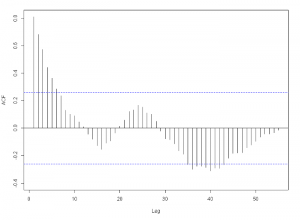
Figure 3: Autocorrelation Function for Total Deaths
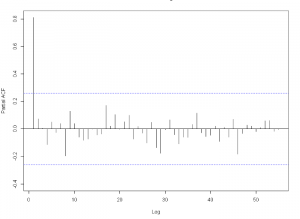
Figure 4: Partial Autocorrelation Function for Total Deaths
How did we choose the best model?
Considering ARIMA(1,2,0) as our initial model, we fit multiple ARIMA models and the resulting model fit measures and error rates are as shown in Table 1.
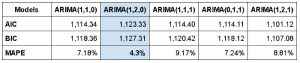
Table 1: Information Criterion (IC) measures and errors rated of fitted ARIMA models
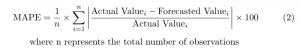
Akaike Information Criterion (AIC) and Bayesian Information Criterion (BIC) are both mathematical methods used to evaluate how well a model fits the data it was generated from; accordingly a lower Criterion value indicates a better fit. The Mean Absolute Percentage Error (MAPE) is calculated by applying the model to the testing data set. The calculation of the MAPE is defined as follows;
According to Table 1; it can be seen that all the fitted ARIMA models have comparatively similar AIC and BIC values but there is a huge difference in the MAPE values. As it is stated above, it can be seen that both the information criterion values are calculated with regards to the same data that is fitted to the model, in our case the training data set but, the MAPE value is calculated with regards to an additional set of data points, in our case the testing data set. Therefore, giving more prominence to MAPE values; despite not having the lowest AIC and BIC, ARIMA(1,2,0) model was concluded as the best model for our purpose.
Additionally, the fitted ARIMA(1,2,0) model also satisfied the Ljung-Box test at 5% level of significance with a p-value of 0.182, thus validating the model assumption that the data is stationary.
What is the Excess Mortality that we predict?
We obtained the forecasted annual deaths without COVID-19 for each year through our model. The COVID-19 deaths for 2020 were easily obtained through the publications of the Epidemiology Unit (Epidemiology Unit, 2020) and for 2021, the deaths due to COVID-19 were obtained with the aid of the COVID-19 projected forecasts published by the Institute of Health Metrics and Evaluation (IHME, 2021).
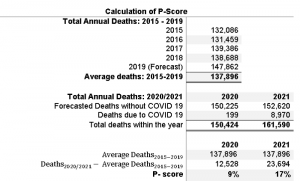
Table 2: Calculation of P-Score
So dear reader, after a bit of modelling with the data we were able to obtain the values in Table 2 for the years 2020 and 2021. Accordingly, our model has forecasted a 9% and 17% excess mortality for Sri Lanka for the year 2020 and 2021 comparative to the last 5 years. In the span of just a year, COVID-19 has almost DOUBLED the excess mortality for Sri Lanka. The immediate cause of the increase of excess mortality in 2021 can be considered as underestimating the potential of the pandemic as a country.
In 2020 Sri Lanka managed to get things under control and while the rest of the world was curious as to how Sri Lanka successfully curtailed the coronavirus pandemic (Deutsche Welle, 2020); we Sri Lankans had no idea that the next wave will hit the country in the upcoming months and we would end up teaching the world how not to respond to COVID-19 (The Diplomat, 2021). So by now, it has become clear that having no plans regarding the possibility of a next wave has led to a needless amount of deaths in the country in 2021. In all of this, it is important to keep in mind that these projections and how the future will actually play out will depend on what we are doing today.
On a final note…
Curious as to what the impact of COVID-19 has been on the Population of Sri Lanka, our analysis was carried out using many assumptions and taking a more visual approach towards identifying the best ARIMA model. But, more accurate predictions may be obtained through applying much more elaborated time series models that can capture latent patterns within the data much more efficiently.
Authors: Rashmini Rathnaweera, Rashmi Jayasekara, Chalani Pradeepika